
It was a wet month of August on Maui. El Niño years tend to bring more tropical moisture. That’s been very true this year, with nearby tropical systems bringing rain and the remnants of dissipated storms bringing enhanced trade wind showers. Hurricane Lala brought widespread heavy rain and wind to the island mid-month. The weather didn’t seem to dampen the local real estate market too much. Condos continued to see improved buyer activity. The home market was a little slower, but most of that was driven by factors other than the weather.
Keep reading the August 2026 Maui Statistics and Market Update for more detailed numbers on buyer activity, inventory levels, and general observations about current market conditions.
What We Are Seeing in The Market
Maui Single Family Home Market
This summer has been slower for home buyers on Maui. After some momentum to start the year, the market has been quieter since the March one-two punch of the Iran War and the Kona low. The Iran war pushed mortgage rates higher and continues to put upward pressure on them. After being close to 6% in January, we are around 7% as I write this post.
With inventory increasing modestly and demand still below normal, we are continuing to see soft prices. That said, the level of price correction varies by both price point and community.
Maui Condo Market
The condo market continued its run of improved activity. This is now the fourth month in a row with more than 70 new pending sales. While this improvement started around the time that it became apparent Bill 88 would pass, I don’t think that is the sole driver of the increased activity. It may not even be the primary driver.
Prices have dropped significantly since Bill 9 was first proposed. As our broker Billy said at the start of the year, this is going to be a year of price discovery. That has been the case since the start of the year, as more motivated sellers have continued to drop prices to attract buyers. It appears motivated sellers are enticing a larger pool of buyers to come off the sidelines. Condos and condo developments that haven’t adjusted their pricing aren’t attracting buyers.
It is also worth noting that while sales volume is certainly better, it is still well below the “normal” transaction volumes we experienced before COVID. This August’s new pending condo sales encapsulate this point well. New pending sales were up almost 65% from last August, but still around 40% below the August average from 2017-2019.
Maui Luxury Property Market
After a very slow July for luxury condo buyer activity, buyers were busy in August. It is a pretty good reminder not to read too much into any one month in the Maui Luxury market. Month-to-month fluctuations are common, which is why we also include year-to-date numbers in our monthly luxury update.
In August, 12 condos priced at $2,000,000 or higher went under contract. That is well above the 4 condos in this price range that went under contract in August 2025. This August’s pending condo sales included 7 in Wailea, 2 in Makena, 2 in Ka’anapali, and 1 in Kapalua. Kai Malu in Wailea was the busiest development with four pendings. With prices in the development down significantly from their peak, buyer activity has increased.
August was the busiest month for luxury condo activity for the year to date. It brings the year-to-date total to 48 for condos priced over $2,000,000 going under contract. In 2025, 55 condos priced over $2,000,000 went under contract during the first eight months of the year. While the gap in activity between this year and last year is shrinking, it remains largely due to slower buyer activity in Wailea, Kihei, and Kapalua year to date. Only Makena and Napili are outpacing 2025 activity.
The luxury home market wasn’t quite as busy in August. Three homes went under contract for more than $3,000,000. They included a home in Puunoa Estates just South of Lahaina, a home in Mahana Ridge in Kapalua, and a home in The Ridge Wailea. Last August, two homes priced over $3,000,000 went under contract.
Year to date, thirty-four homes priced at $3,000,000 or above have gone under contract. That is well below last year’s 48 homes through the end of August. The quieter 2026 market is largely due to lower sales activity in West Maui. Napili, Kapalua, and Ka’anapali are all underperforming 2025 activity levels. However, buyer activity in Kapalua and Ka’anapali has improved since the first quarter. In fact, island-wide activity from April through August matches the same period last year.
What Does It Mean for Buyers and Sellers?
Current market conditions remain more favorable for buyers than sellers. Soft prices, decent inventory, and limited competition mean more leverage. However, as noted in other market updates, seller motivation varies widely. While some sellers are truly motivated, others are holding firm. Motivation may not always be reflected in the list price, so it is worth making offers.
For sellers, these are more challenging market conditions, and the sellers who are having the most success are pricing well from the start and listening to market feedback. If you have the means, it is worth addressing deferred maintenance before going to market. Affordability remains a challenge for many buyers. That means buyers may not have the funds to address necessary repairs. If you can’t do the work or don’t have the means, reflect it in your list price or address it with a closing credit.
Listing Spotlight
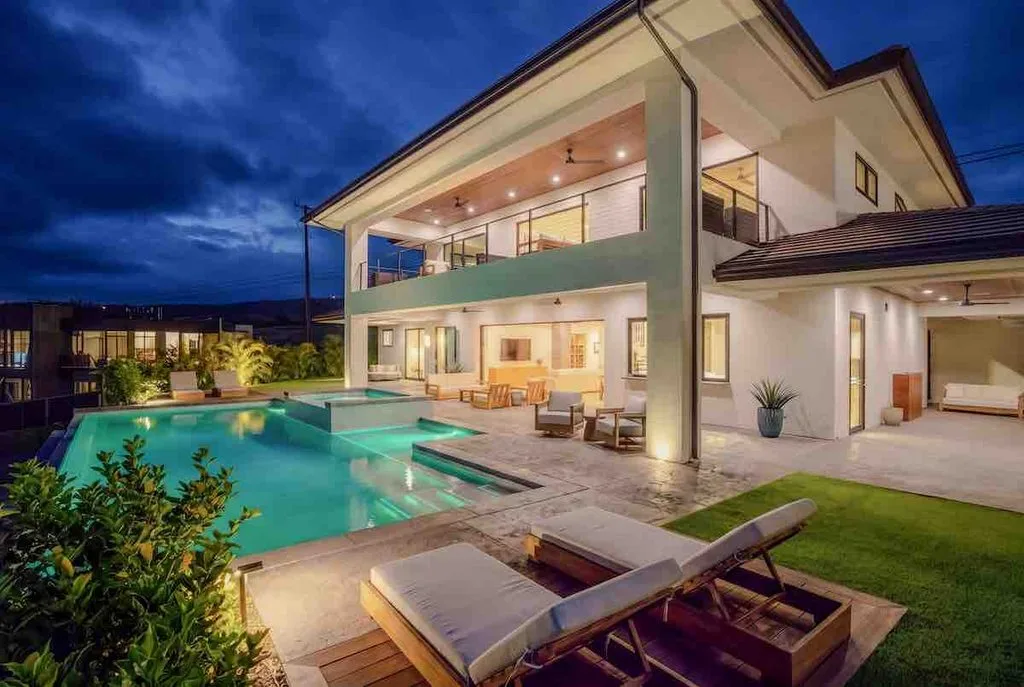
This month we are featuring 22 Halapa Place in the Ridge at Wailea subdivision. This newly constructed home was built and designed to entertain. Some of the standout features include a wine room, chef’s kitchen, an infinity pool and spa, and an extensive lanai space with a full bar and barbecue area with a hidden big screen TV. Check out the 22 Halapa Place listing page for more photos and details.
August 2026 Market Activity
If you are a first-time reader of one of our market updates, here’s some quick background on how we do our stats. First, these numbers are for Maui only. The Realtor Association of Maui stats include the islands of Molokai and Lanai, too. We like to provide context, so we include data for the same month for the last three years, the crazy year that was 2021, and the monthly average between 2017 and 2019 to give a better sense of “normal” market conditions.
New Listings
| August 2026 | August 2025 | August 2024 | August 2023 | August 2021 | August Avg. 2017-2019 | |
| Homes | 85 | 93 | 75 | 46 | 134 | 123 |
| Condos | 113 | 129 | 137 | 72 | 159 | 149 |
New home listings in August were 8.6% below last August and 30.9% below the August Average from 2017-2019. New condo listings decreased 12.4% from last August and were 24.6% below the August average from 2017-2019.
New Pending Sales
| August 2026 | August 2025 | August 2024 | August 2023 | August 2021 | August Avg. 2017-2019 | |
| Homes | 48 | 47 | 43 | 56 | 126 | 88 |
| Condos | 79 | 48 | 49 | 62 | 144 | 133 |
New pending homes were up just 2.1% (1 home) from August 2025, but were 45.5% below the August average from 2017-2019. New pending condo sales increased 64.6% from August 2025, but were still 40.6% below the August average from 2017-2019.
Closed Transactions
| August 2026 | August 2025 | August 2024 | August 2023 | August 2021 | August Avg. 2017-2019 | |
| Homes | 61 | 60 | 62 | 57 | 120 | 97 |
| Condos | 69 | 54 | 64 | 97 | 187 | 125 |
There was one more home sale this August than last August. This August remains well off the pace of pre-COVID activity. This year was 37.1% below the August average from 2017-2019.
End of August Maui Home Inventory
| June 30, 2026 | July 31, 2026 | August 31, 2026 | ||||
| Active | Pending | Active | Pending | Active | Pending | |
| <$750,000 | 7 | 4 | 8 | 6 | 13 (+5) | 5 (-1) |
| $750,000-$999,999 | 31 | 22 | 28 | 27 | 31 (+3) | 17 (-10) |
| $1,000,000-$1,499,999 | 111 | 41 | 119 | 35 | 117 (-2) | 35 |
| $1,500,000-$1,999,999 | 87 | 14 | 91 | 16 | 84 (-7) | 13 (-3) |
| $2,000,000-$2,999,999 | 62 | 4 | 58 | 9 | 57 (-1) | 9 |
| $3,000,000-$4,999,999 | 54 | 2 | 54 | 4 | 60 (+6) | 4 |
| $5,000,000-$9,999,999 | 49 | 3 | 41 | 5 | 38 (-3) | 7 (+2) |
| $10,000,000-$19,999,999 | 21 | 2 | 25 | 1 | 24 (-1) | 1 |
| $20,000,000 | 8 | 0 | 9 | 0 | 11 (+2) | 0 |
| Totals | 430 | 92 | 433 | 103 | 435 (+2) | 91 (-12) |
| June 30, 2026 | July 31, 2026 | August 31, 2026 | ||||
| Active | Pending | Active | Pending | Active | Pending | |
| Haiku | 49 | 10 | 46 | 10 | 44 (-2) | 8 (-2) |
| Hana | 21 | 0 | 20 | 1 | 17 (-3) | 1 |
| Ka’anapali | 15 | 1 | 12 | 5 | 13 (+1) | 4 (-1) |
| Kahului | 28 | 17 | 29 | 11 | 30 (+1) | 9 (-2) |
| Kapalua | 14 | 1 | 14 | 1 | 14 | 2 (+1) |
| Kihei | 62 | 15 | 64 | 19 | 67 (+3) | 16 (-3) |
| Kula | 36 | 11 | 34 | 13 | 38 (+4) | 10 (-3) |
| Lahaina | 24 | 3 | 24 | 3 | 23 (-1) | 3 |
| Makawao | 18 | 4 | 26 | 6 | 28 (+2) | 7 (+1) |
| Maui Meadows | 18 | 0 | 19 | 2 | 13 (-6) | 4 (+2) |
| Napili/Kahana/Hono… | 26 | 7 | 27 | 5 | 33 (+6) | 1 (-4) |
| Pukalani | 12 | 4 | 10 | 5 | 10 | 3 (-2) |
| Sprecks/Paia | 16 | 0 | 13 | 2 | 15 (+2) | 2 |
| Wailea | 29 | 1 | 27 | 4 | 29 (+2) | 4 |
| Wailuku | 58 | 18 | 65 | 16 | 56 (-9) | 17 (+1) |
Notable Numbers From the End of August Maui Home Inventory
The number of active home listings was relatively stable, with just two more homes on the market on the last day of August compared to the last day of July. Pending sales decreased by 12 (11.66%).
Looking at active inventory by price point, a few things stood out. The $2,000,000-$3,000,000 price range has decreased modestly but steadily throughout the year. The active inventory below $750,000 hit its highest level this year. This reflects both price adjustments and a recent increase in mortgage rates. At the opposite end of the market, the $20,000,000+ and above price range also hit a new high for the year.
Pending home sales by price point continue to fluctuate month to month. The only price range with consecutive months of increased pending sales was between $5,000,000 and $9,999,999. No price range had consecutive months of decreasing pending sales.
Shifting to active listings by community. Haiku and Makawao stand out. After a steady increase in active listings during the Spring, Haiku has seen the third consecutive month of declines. Makawao has followed the opposite trajectory, with end-of-month active listings increasing for the fourth consecutive month.
No notable trends emerged when looking at pending sales by community. Maui Meadows has seen a recent uptick in pending sales after seeing lower pending sales earlier in the summer. While Makawao’s active listings have increased, we have also seen a couple of months in a row of increased pending sales. Meanwhile, the Napili, Kahana, and Honokowai area has seen a couple of quieter months of activity with just one pending sale at the end of August.
End of August Maui Condo Inventory
| June 30, 2026 | July 31, 2026 | August 31, 2026 | ||||
| Active | Pending | Active | Pending | Active | Pending | |
| <$250,000 | 36 | 5 | 39 | 6 | 40 (+1) | 6 |
| $250,000-$499,999 | 136 | 22 | 126 | 30 | 125 (-1) | 31 (+1) |
| $500,000-$749,999 | 212 | 35 | 213 | 28 | 206 (-7) | 29 (+1) |
| $750,000-$999,999 | 171 | 26 | 157 | 24 | 145 (-12) | 17 (-7) |
| $1,000,000-$1,499,999 | 131 | 10 | 120 | 13 | 124 (+4) | 16 (+3) |
| $1,500,000-$1,999,999 | 67 | 5 | 67 | 2 | 60 (-7) | 2 |
| $2,000,000-$2,999,999 | 56 | 2 | 53 | 2 | 42 (-11) | 5 (+3) |
| $3,000,000-$4,999,999 | 45 | 4 | 42 | 1 | 38 (-4) | 5 (+4) |
| $5,000,000-$9,999,999 | 17 | 2 | 15 | 0 | 12 (-3) | 2 (+2) |
| $10,000,000+ | 5 | 0 | 6 | 0 | 6 | 0 |
| Totals | 876 | 111 | 838 | 106 | 798 (-40) | 113 (+7) |
| June 30, 2026 | July 31, 2026 | August 31, 2026 | ||||
| Active | Pending | Active | Pending | Active | Pending | |
| Ka’anapali | 141 | 11 | 139 | 11 | 136 (-3) | 15 (+4) |
| Kahului | 25 | 2 | 28 | 0 | 27 (-1) | 2 (+2) |
| Kapalua | 62 | 2 | 59 | 3 | 54 (-5) | 4 (+1) |
| Kihei | 279 | 43 | 258 | 42 | 242 (-16) | 42 |
| Lahaina | 25 | 4 | 24 | 3 | 25 (+1) | 4 (+1) |
| Ma’alaea | 24 | 2 | 24 | 2 | 20 (-4) | 3 (+1) |
| Napili/Kahana/Hono… | 186 | 20 | 185 | 21 | 184 (-1) | 16 (-5) |
| Pukalani | 2 | 1 | 2 | 0 | 1 | 1 |
| Wailea | 90 | 9 | 86 | 6 | 71 (-15) | 12 (+6) |
| Wailuku | 40 | 17 | 31 | 18 | 37 (+6) | 14 (-4) |
Notable Numbers from the End of August Maui Condo Inventory
The number of active condo listings fell by 4.8% (40 condos) between the end of July and the end of August. While listings are still high by historical standards, this is the first time in 13 months that condo inventory fell below 800 at month-end. The number of pending condo sales rose by 6.6% (7 condos) between July 31st and August 31st.
Looking at active listings by price point, a few ranges stand out. Active listings in the $750,000-$999,000 price range decreased for the fourth consecutive month. In total, the number of condos at that price point is down 23.7% since the end of April. The $5,000,000-$9,999,999 price range decreased for the sixth consecutive month. Active listings are down 53.8% since the end of February. At the other end of the spectrum, condo listings below $250,000 have increased every month this year.
A review of the end-of-the-month pending condo sales doesn’t reveal any discernible trends. Month-to-month fluctuations are the recent normal, though a few price ranges show consecutive months of rising pending sales.
The South Maui communities of Wailea and Kihei have both seen active listings decrease for four consecutive months. Other communities with two consecutive months of decreased active listings include Kapalua and the Napili, Kahana, and Honokowai area.
Pending condo sales by community have fluctuated month to month. Kapalua is the one community with three consecutive months of increased pending sales. That said, the increase has been modest, with just one pending at the end of May and four at the end of August.
>> Contact The Maui Real Estate Team with questions, comments, or for assistance with buying or selling Maui property. We look forward to the opportunity to get to meet you and learn about your needs.