

July came and went without too many fireworks in the Maui Real Estate Market. Home buyer activity is similar in pace to what we have seen over the last couple of years, while the condo market continues to see improved, but still below “normal” activity levels. Keep reading the July 2026 Maui Statistics and Market update for more information on new pending sales, new inventory, and end-of-month inventory levels. Without further ado, here are our observations and the numbers.
What We Are Seeing in the Market
Maui Single Family Home Market
After a pretty busy June for buyer activity, July home buyer activity was more in line with what we have seen over the last couple of years and still 33% below what was typical in July pre-COVID. Inventory increased nominally, with just three more homes on the market at month-end than on the last day of June.
With demand relatively low compared to inventory, pricing in the single-family home market is soft overall. That said, market conditions can vary pretty broadly by both price point and community.
Maui Condo Market
The condo market had its third straight month of more than 70 pending sales. These last three months were three of the four best months for buyer activity since Bill 9 was proposed. Only February of this year was better. The increased buyer activity is also driving inventory levels down.
Before condo owners and sellers pop the champagne corks, it is worth noting that inventory levels are still well above pre-COVID levels while demand is still over 30% below pre-COVID activity. A lot of the activity is concentrated in condos that experienced the biggest declines in value over the last couple of years. Sellers in those developments have been adjusting downward to find the market, and more of them appear to be having success.
Bill 88 has also contributed to increased buyer activity. The prospect of continued short-term rentals at some Bill 9-impacted condos is bringing some buyers off the sidelines. Just to be clear, this doesn’t mean any condos have been rezoned
Maui Luxury Property Market
July was a pretty busy month for the luxury home market. Luxury condos? Not so much.
Eight homes priced over $3,000,000 went under contract in July. Activity was spread across the island with one new pending each in Kula, Maui Meadows, Wailea, and Kapalua, and two each in Makena and Ka’anapali. By comparison, six homes priced over $3,000,000 went under contract last July.
For the year to date, thirty-two homes went under contract. Last year, forty-six homes went under contract during the first seven months of the year. While luxury activity is still lagging well behind last year, that can be attributed to a much slower first quarter. Since April 1st, 23 homes have gone under contract. The same number as the same period of 2025.
Only one condo priced over $2,000,000 went under contract in July. It was a listing at the Ridge in Kapalua. Last July, seven condos priced over $2,000,000 went under contract. I can’t say that there was any big driver for the slower month of activity. Last month’s numbers exceeded the June 2025 activity. Sometimes you just get month-to-month variability.
That said, this has been a quieter year overall. Thirty-five condos priced over $2,000,000 went under contract this year compared to fifty-two over the same period in 2025.
What Does it Mean for Buyers and Sellers?
Market conditions continue to favor buyers for both homes and condos. That said, there are some caveats. Buyers will find a broad range of seller motivation. Some are realistic about current market conditions, while others are still in a 2021/2022 mindset. Buyers should also be realistic about what this buyer’s market means. These conditions translate to more negotiation on prices and terms, and a sales price at or potentially below other recent sales. It doesn’t mean complete seller capitulation or a return to 2018/2019 pricing. Well-priced properties in good condition can still attract multiple offers.
Sellers, if you read the paragraph above, you should have a sense of Maui’s overall market conditions. More inventory means more competition for a smaller pool of buyers. While prices are softer, they still pose affordability challenges for many buyers. That means that buyers have less money for projects, deferred maintenance, and other repairs. If you have the means to address issues before going to market, it will broaden your pool of buyers. If you don’t have the means, consider offering a credit at closing to cover some repair expenses.
Both buyers and sellers should be aware that market conditions vary by community, price point, or both. Contact the Maui Real Estate Team to learn more about market conditions specific to your interests.
Property of the Month
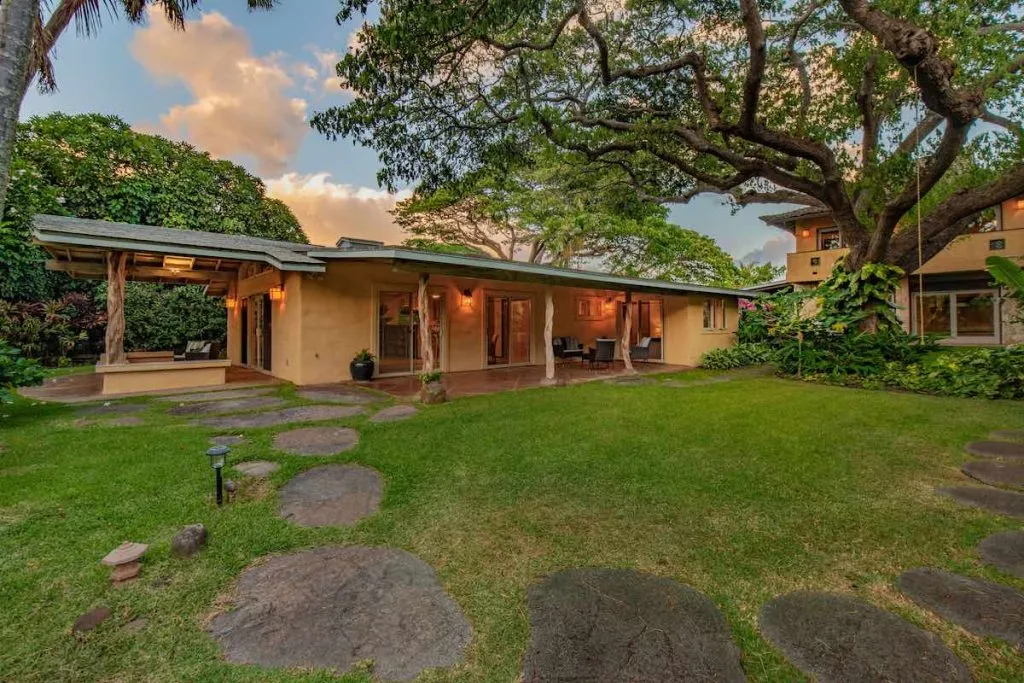
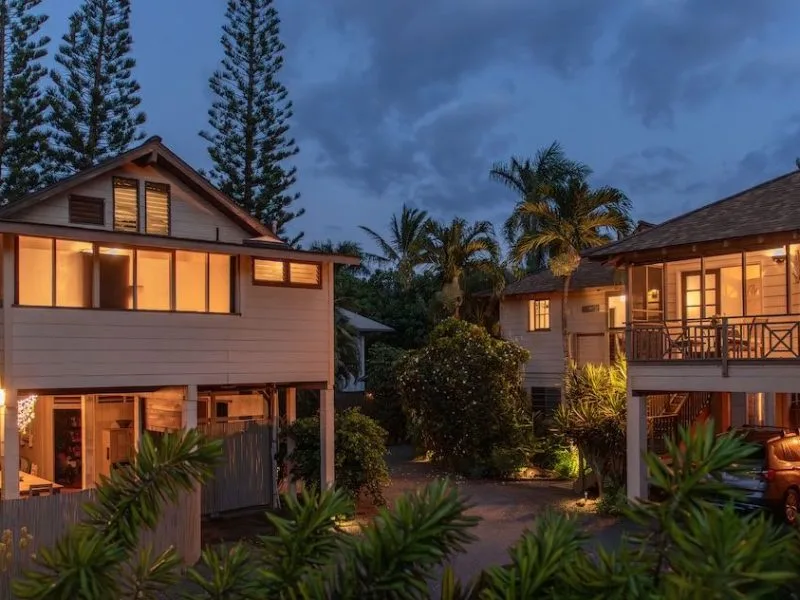
This month’s featured property is 450 Laulea Place in Spreckelsville. The house and cottage are located on one of Spreckelsville’s most desired streets. The main home was built in 1960 and completely reimagined in 1996. The elevated, Bali-inspired cottage was built in 2006. This home just has a great feel. Check out the 450 Laulea MLS listing for more photos and details.
July 2026 Maui Market Activity
If you are a first-time reader of one of our market updates, I wanted to give some quick background on how we do our stats. First, these numbers are for Maui only. The Realtor Association of Maui stats include Molokai and Lanai, too. We like to provide context, so we include data for the same month for the last three years, the crazy year that was 2021, and the monthly average between 2017 and 2019 to give a better sense of “normal” market conditions.
New Listings
| July 2026 | July 2025 | July 2024 | July 2023 | July 2021 | July Avg. 2017-2019 | |
| Homes | 93 | 92 | 85 | 79 | 123 | 124 |
| Condos | 108 | 123 | 141 | 87 | 124 | 159 |
There was just one more new home listing this July compared to last July, but new inventory was still 33.3% below the July average from 2017 to 2019. New condo listings in July were 12.2% lower than last July and 32.1% below the July average from 2017 to 2019.
New Pending Sales
| July 2026 | July 2025 | July 2024 | July 2023 | July 2021 | July Avg. 2017-2019 | |
| Homes | 59 | 59 | 52 | 49 | 102 | 91 |
| Condos | 76 | 58 | 48 | 62 | 153 | 117 |
New pending home sales in July were the exact same number as last July, but 35.2% below the July average from 2017-2019. New pending condo sales in July increased 31% from last July but remained 35% below the July average from 2017-2019.
Closed Transactions
| July 2026 | July 2025 | July 2024 | July 2023 | July 2021 | July Avg. 2017-2019 | |
| Homes | 56 | 57 | 50 | 65 | 107 | 93 |
| Condos | 73 | 57 | 48 | 62 | 153 | 125 |
The number of homes that sold this July was one less than last July, but remained 39.8% below the July average from 2017-2019. The number of condos sold in July increased 28% above last July, but was 41.6% below the July average from 2017-2019.
End of July Maui Home Inventory
| May 31, 2016 | June 30, 2026 | July 31, 2026 | ||||
| Active | Pending | Active | Pending | Active | Pending | |
| <$750,000 | 8 | 5 | 7 | 4 | 8 (+1) | 6 (+2) |
| $750,000-$999,999 | 30 | 15 | 31 | 22 | 28 (-3) | 27 (+5) |
| $1,000,000-$1,499,999 | 102 | 36 | 111 | 41 | 119 (+8) | 35 (-6) |
| $1,500,000-$1,999,999 | 81 | 21 | 87 | 14 | 91 (+4) | 16 (+2) |
| $2,000,000-$2,999,999 | 63 | 12 | 62 | 4 | 58 (-4) | 9 (+5) |
| $3,000,000-$4,999,999 | 50 | 4 | 54 | 2 | 54 | 4 (+2) |
| $5,000,000-$9,999,999 | 46 | 5 | 49 | 3 | 41 (-8) | 5 (+2) |
| $10,000,000-$19,999,999 | 21 | 3 | 21 | 2 | 25 (+4) | 1 (-1) |
| $20,000,000+ | 8 | 0 | 8 | 0 | 9 (+1) | 0 |
| Totals | 409 | 101 | 430 | 92 | 433 (+3) | 103 (+9) |
| May 31, 2026 | June 30, 2026 | July 31, 2026 | ||||
| Active | Pending | Active | Pending | Active | Pending | |
| Haiku | 51 | 6 | 49 | 10 | 46 (-3) | 10 |
| Hana | 19 | 1 | 21 | 0 | 20 (-1) | 1 (+1) |
| Ka’anapali | 12 | 2 | 15 | 1 | 12 (-3) | 5 (+4) |
| Kahului | 29 | 13 | 28 | 17 | 29 (+1) | 11 (-6) |
| Kapalua | 16 | 1 | 14 | 1 | 14 | 1 |
| Kihei | 59 | 11 | 62 | 15 | 64 (+2) | 19 (+4) |
| Kula | 31 | 12 | 36 | 11 | 34 (-2) | 13 (+2) |
| Lahaina | 25 | 5 | 24 | 3 | 24 | 3 |
| Makawao | 14 | 10 | 18 | 4 | 26 (+8) | 6 (+2) |
| Maui Meadows | 14 | 1 | 18 | 0 | 19 (+1) | 2 (+2) |
| Napaili/Kahana/Hono… | 28 | 3 | 26 | 7 | 27 (+1) | 5 (-2) |
| Pukalani | 10 | 6 | 12 | 4 | 10 (-2) | 5 (+1) |
| Sprecks/Paia | 16 | 1 | 16 | 0 | 13 (-3) | 2 (+2) |
| Wailea | 26 | 4 | 29 | 1 | 27 (-2) | 4 (+3) |
| Wailuku | 55 | 24 | 58 | 18 | 65 (+7) | 16 (-2) |
Notable Numbers from the end of July Maui Home Inventory
The number of active home listings on Maui increased by 3 homes, or less than one percent, between June 30th and June 31st. The number of pending sales increased by 9 homes, or 9.8%, between the last day of June and the last day of July.
Looking at active listings by price point, the $2,000,000-$3,000,000 range has now seen inventory decrease for the sixth straight month. The number of homes in that price range that went under contract through the first seven months of the year has been higher than the last two years. However, I think some of that decline may be due to homes in the low $2,000,000s dropping their price below $2,000,000. Pending sales increased for two straight months in the $1,500,000-$1,999,999 and $1,000,000-$1,499,999 ranges.
Pending sales in the $750,000-$999,999 price range increased substantially over the last two months. The 27 pending sales is the highest end-of-month total for the year to date. Almost all other price ranges are seeing month-to-month fluctuations in pending sales. Only the $10,000,000-$19,999,999 price range had consecutive months of declining pending sales.
Shifting to communities, Makawao inventory grew steadily over the last couple of months from 14 to 26 active listings. Kihei inventory has also increased over the last few months. Haiku, which recently saw a surge in listings in late spring and early summer, has had two consecutive months of declining active listings. Most other communities are just seeing month-to-month fluctuations.
There aren’t many trends, or even consecutive months of increases or declines, when looking at pending sales by community. While Kihei has seen an increase in inventory, it is the only community to see two straight months of increased pendings.
End of July Maui Condo Inventory
| May 31, 2026 | June 30, 2026 | July 31, 2026 | ||||
| Active | Pending | Active | Pending | Active | Pending | |
| <$250,000 | 33 | 4 | 36 | 5 | 39 (+3) | 6 (+1) |
| $250,000-$499,999 | 122 | 26 | 136 | 22 | 126 (-10) | 30 (+8) |
| $500,000-$749,999 | 217 | 35 | 212 | 35 | 213 (+1) | 28 (+7) |
| $750,000-$999,999 | 182 | 25 | 171 | 26 | 157 (-14) | 24 (-2) |
| $1,000,000-$1,499,999 | 138 | 10 | 131 | 10 | 120 (-11) | 13 (+3) |
| $1,500,000-$1,999,999 | 56 | 10 | 67 | 5 | 67 | 2 (-3) |
| $2,000,000-$2,999,999 | 55 | 2 | 56 | 2 | 53 (-3) | 2 |
| $3,000,000-$4,999,999 | 44 | 5 | 45 | 4 | 42 (-3) | 1 (-3) |
| $5,000,000-$9,999,999 | 20 | 0 | 17 | 2 | 15 (-2) | 0 (-2) |
| $10,000,000+ | 6 | 0 | 5 | 0 | 6 (+10 | 0 |
| Totals | 873 | 117 | 876 | 111 | 838 (-38) | 106 (-5) |
| May 31, 2026 | June 30, 2026 | July 31, 2026 | ||||
| Active | Pending | Active | Pending | Active | Pending | |
| Ka’anapali | 135 | 14 | 141 | 11 | 139 (-20 | 11 |
| Kahului | 25 | 3 | 25 | 2 | 28 (+3) | 0 (-2) |
| Kapalua | 59 | 1 | 62 | 2 | 59 (-3) | 3 (+1) |
| Kihei | 290 | 42 | 279 | 43 | 258 (-21) | 42 (-1) |
| Lahaina | 25 | 9 | 25 | 4 | 24 (-1) | 3 (-1) |
| Ma’alaea | 25 | 1 | 24 | 2 | 24 | 2 |
| Napili/Kahana/Hono… | 173 | 23 | 186 | 20 | 185 (-1) | 21 (+1) |
| Pukalani | 3 | 0 | 2 | 1 | 2 | 0 (-1) |
| Wailea | 99 | 9 | 90 | 9 | 86 (-4) | 6 (-3) |
| Wailuku | 37 | 15 | 40 | 17 | 31 (-9) | 18 (+1) |
Notable Numbers from the End of July Maui Condo Inventory
The number of active condo listings decreased by 4.3% (38 condos) between the end of June and the end of July. The number of pending condo sales decreased by 4.5% (5 condos) between June 30th and July 31st.
The $750,000-$999,999 price range had its third straight month of declining active listings. The $1,000,000-$1,499,999 price range increased for its second straight month. On the other end of the spectrum, condos priced below $250,000 had their sixth straight month of increasing inventory. While these condos may be more accessible in price, many have seen sizable increases in association fees over the last few years, limiting their appeal.
The sub-$250,000 condo market has seen three straight months of increased pendings, but they only rose from 1 pending in May to 6 at the end of June. No other price ranges had consecutive increases or decreases in pending sales.
Much of the decrease in condo inventory appears to be occurring in Kihei. It declined from 295 active listings on April 30th to 258 on July 31st. Wailea also saw a notable decrease, from 109 condos on April 30th to 86 on July 31st.
Pending sales in Wailuku increased for the third consecutive month. Almost all other communities have seen month-to-month fluctuations in pending sales.
>> Contact The Maui Real Estate Team with questions, comments, or for assistance with buying or selling Maui property. We look forward to the opportunity to get to meet you and learn about your needs.